Starry, starry night
 The holidays are nearing, and it always makes me ponder the universe. Maybe it’s because the stars come out in the cold and clear dark winter evenings, or maybe it’s because of the unusually bright star in the Christmas story. Anyway, it gave me the idea of creating something like a classic 3D star field. What if you used actual star positions for this star field, and would you see something like you do on Star Trek if you flew through it at warp speed?
I started out by searching for star catalogs. These are plain text databases with lots and lots of scientific data about the stars.
Star databases are a bit of an annoyance; each has its own format, and they all contain different fields. Some contain parallax data (which is needed for calculating the distance of stars), but most don’t. Some contain the visible color of stars, others don’t. But most annoying of all, they don’t use the same unique identifiers; star Procyon A is named HIP-37279 in the Hipparcos catalog, HD 61421 in the Henry Draper catalog, Gliese 280 in the Gliese catalog, while it’s Bayer Flamsteed designation is 10 Alpha Canis Minoris.
The Tycho-2 star catalog contains over 2.5 million stars, but unfortunately it is worthless for making a 3D model because it lacks parallax data. So I took the HYG database, which is a modified version of the Hipparcos database, and combined it with usable data from the SKY2000 star catalog, plus a short list of well-known brightest stars. This involved some awk and python scripting to cross reference the databases and calculate the 3D positions.
Star positions are usually given in right ascension (RA) and declination (Dec). These are angles, like latitude and longitude, but are often described in hours, minutes, and seconds. Given the angles and the parallax, you can calculate an x,y,z position in space, and this is what we need for a 3D star field. These coordinates have the earth at its origin. You might want to use galactic coordinates instead, which puts the Sun at the origin.
Now, because all of this stuff is turning, turning in outer space, the positions of stars change (unlike what I was told as a child). Star databases contain the position at a point in time (referred to as the epoch) and you can adjust the position using the proper motion of stars. Frankly, I didn’t bother, but if you want to know the correct position of a star as it is today, you are going to have to do some extra math.
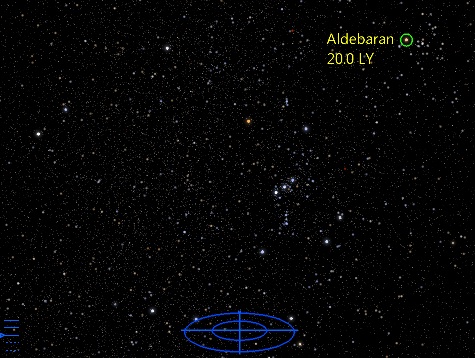
So, I put all coordinates into OpenGL and the result is pretty neat. In the left image you can clearly see Orion. The red star in the top-left of Orion is Betelgeuse. All the way to the left from Betelgeuse is Procyon. The image on the right shows what you see from a distance of 4 kiloparsecs. It’s like a bubble with a disc through the center. This is just what the data set looks like though; in reality, it probably does not have this shape as we are part of a much, much larger Milky Way.
This is what almost 220 thousand stars look like on a computer screen, and you can look around and point at stars in real-time.
Fun facts:
- The furthest bright star, just outside the bubble, is Deneb at 4754.8 light years.
- Most stars around us are red dwarfs. Hence the pinkish color of the bubble.
- When you travel to another star, the night sky looks different.
- OpenGL vertex buffer objects (VBO) kick ass.
I was amazed that my (now three years old) computer had no problems whatsoever in dealing with this data. Once again, I find that the modern PC is an amazingly powerful computer. Although I’m no scientist and no astronomer, it enabled me to put together a pretty realistic 3D model of our stellar neighborhood in my attic.

